Bioreactor Design. The components and the assembly of the bioreactor are illustrated, as well as the membrane in its flat and inflated state. Source [3]
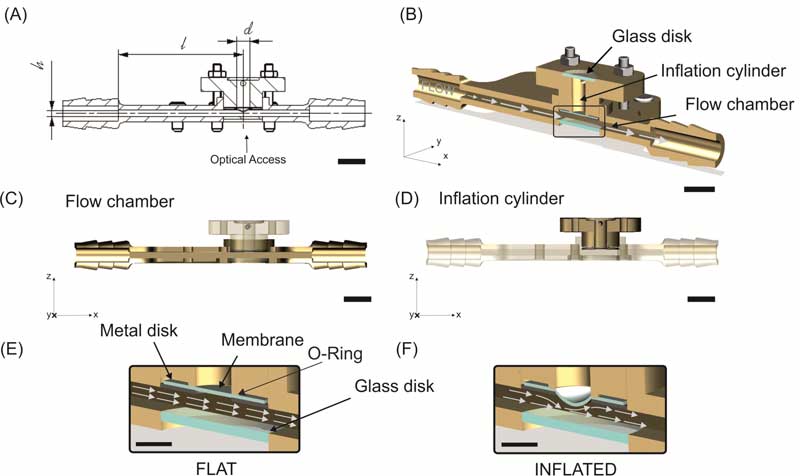
Figure 1. Design of the System. (A): Bioreactor chamber dimensions. l = 47 mm (entrance length); h = 2.5 mm (chamber height); w = 6 mm (chamber width, not shown) and d = 5 mm (diameter of the inflated membrane). (B): Global cross section view of the bioreactor. (C) View of the reactor with transparent inflation part. (D) View of the reactor with transparent flow part. The insets show the membrane (clamped in between Metal disk and O-Ring) in its flat state (E), corresponding to the minimum shear stress, and its maximum inflated state (F) that corresponds to the maximum shear stress conditions. The scale bars in panels (A)-(D) correspond to 10 mm and the scale bars in panels (E) and (F) to 5 mm, respectively. Source [3]
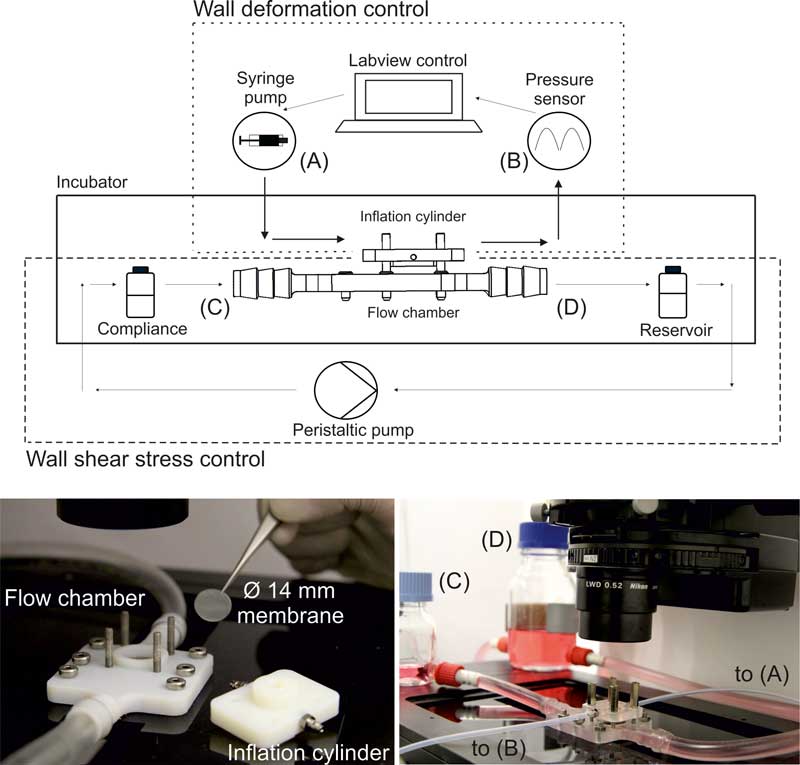
Figure 2. Control of actuation. The set-up consists of two independently controlled components. The inflation cylinder is actuated by a syringe pump (A). The pressure in the inflation cylinder is monitored by a sensor (B) and controlled via a custom-developed LabView software. The flow chamber is actuated by a peristaltic pump connected to a compliance (C) and a reservoir (D). Source [3]
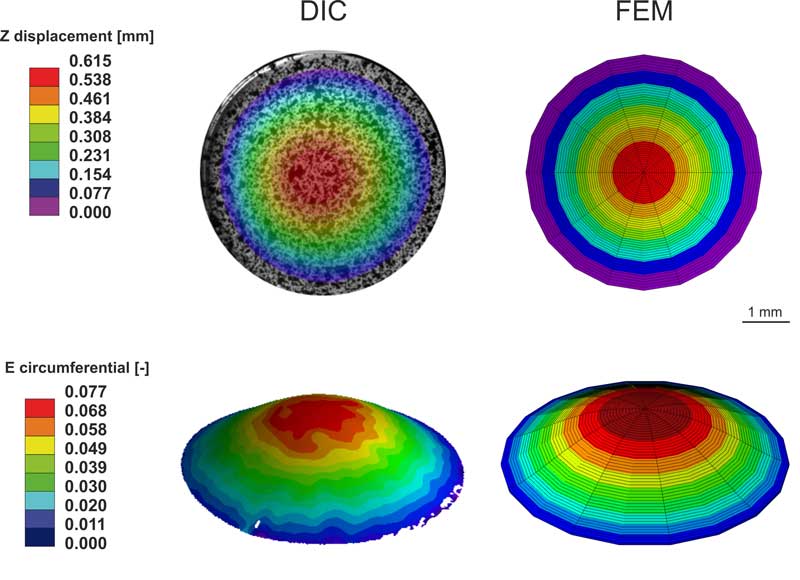
Figure 3. Validation of the inflation cylinder. Comparison between Digital Image Correlation (DIC) results for a 500 µm thick membrane loaded with 220 mbar pressure and the corresponding Finite Element Model (FEM). Top: Z displacement. The max displacement given by the DIC measurement is 0.615 mm; the predicted FE displacement is 0.614 mm. Bottom: Strain. The apex strain given by the DIC measurement is 7.7%; the predicted FE maximum strain is 8.4%. Source [3]
Laura Bernardi
Live imaging of HUVECs on reactor membrane. 8% stretch, ~1 Hz, 0.4 l/min flow. The membrane is imaged 2 mm from the inlet edge, where the maximum WSS is created. As the physiological conditions are not exceeded, the full coverage is maintained. Source [3]
Live imaging of HUVECs on reactor membrane. 8% stretch, ~1 Hz, 0.6 l/min flow. The membrane is imaged 2 mm from the inlet edge, where the maximum WSS is created. As the physiological conditions are exceeded, HUVECs detach from the membrane in the area of maximum WSS. Source [3]
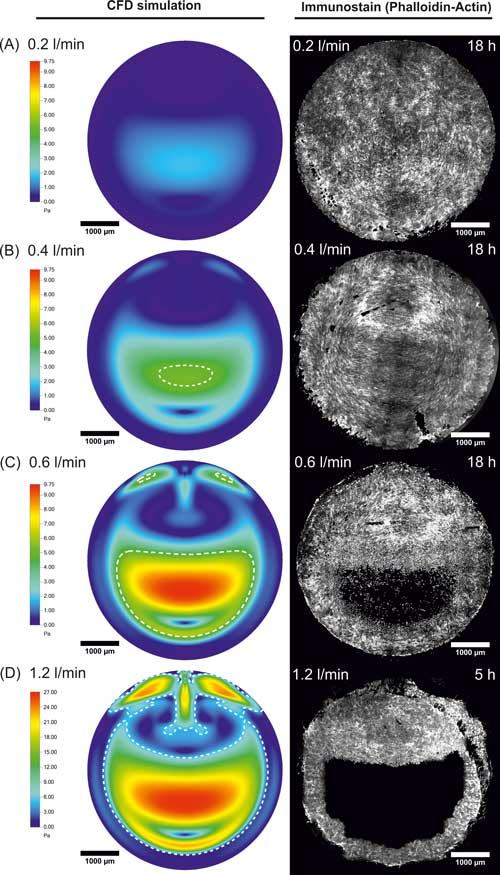
Figure 1. Endothelialization under complex hemodynamic conditions. (A-D) WSS patterns computed for the combined actuation of the flow channel and the inflation cylinder for an imposed flow of 0.2, 0.4, 0.6, and 1.2 l/min, respectively (left). The WSS maps correspond to the fully inflated state for a target 8 % cyclic biaxial strain. The dashed white line delimits regions that feature more than 5 Pa WSS. The right column reports the filamentous actin staining on HUVECs cells on a 5 mm diameter PDMS deformable membrane after 18 h conditioning. Note that at flow rates of 0.6 l/min (C) and higher (D) endothelialization was absent in the region of the membrane exposed to supraphysiological WSS. Source [3]
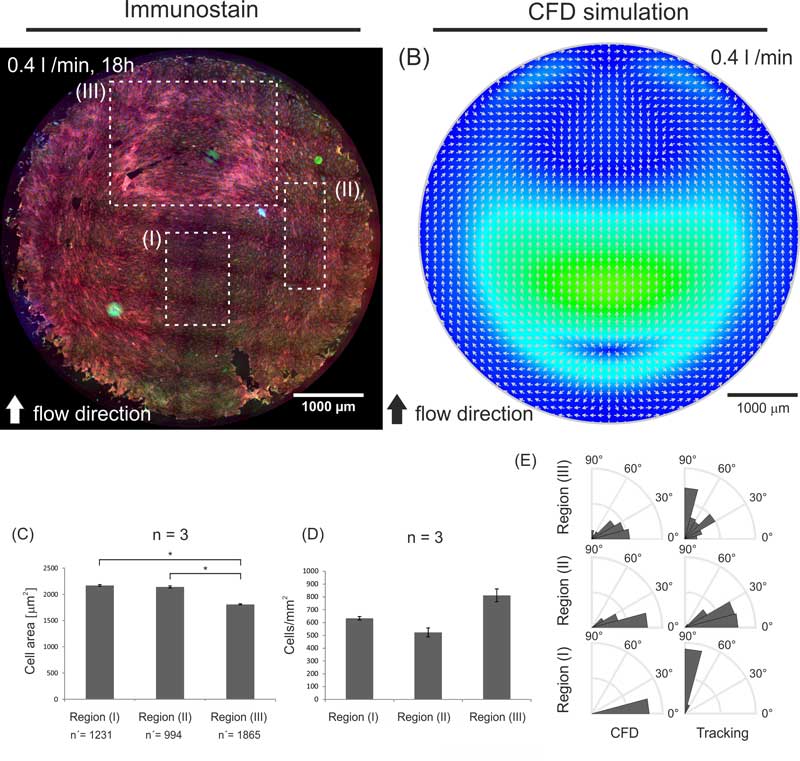
Figure 2. Effect of complex WSS and WD patterns on surface endothelialization. (A) Fluorescent images of an endothelium covering the deformable membrane after 18 h of flow conditioning at 0.4 l/min and membrane deformation at 8% maximal strain and 1 Hz frequency. (Red = Actin, Blue = Nuclei, Green = VEC). (B) Three regions of interest (I, II, and III) were selected corresponding to areas exposed to different WSS in the fully inflated state of the deformable membrane (Figure 1F). (C) Corresponding measure for cell area and (D) cell density. Significant differences for the cell area are reported (* for α<0.05). n denotes the number of independent experiments and n' denotes the number of measured cells. Error bars correspond to the standard error of the mean. (E) The rose plots report the measured cells alignment (tracking) to the direction of flow as predicted by CFD analysis (CFD). Source [3]
Björn Johann Bachmann, Christian Loosli
Wide range mechanical analysis of silicone-based materials for the hybrid membrane was performed. This video shows some of the tests included in the characterization protocol, as cyclic tensile tests, inflation tests, and fracture tests.
Laura Bernardi
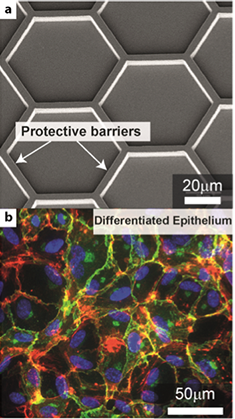
Synthetic substrate supporting tissue growth. Micrograph: (a) Surface topography featuring patches with protective barriers generated on a thermoplastic polymer. (b) Resulting endothelial tissue showing the cell nuclei (blue), cytoskeleton (red) and cell junctions (green).